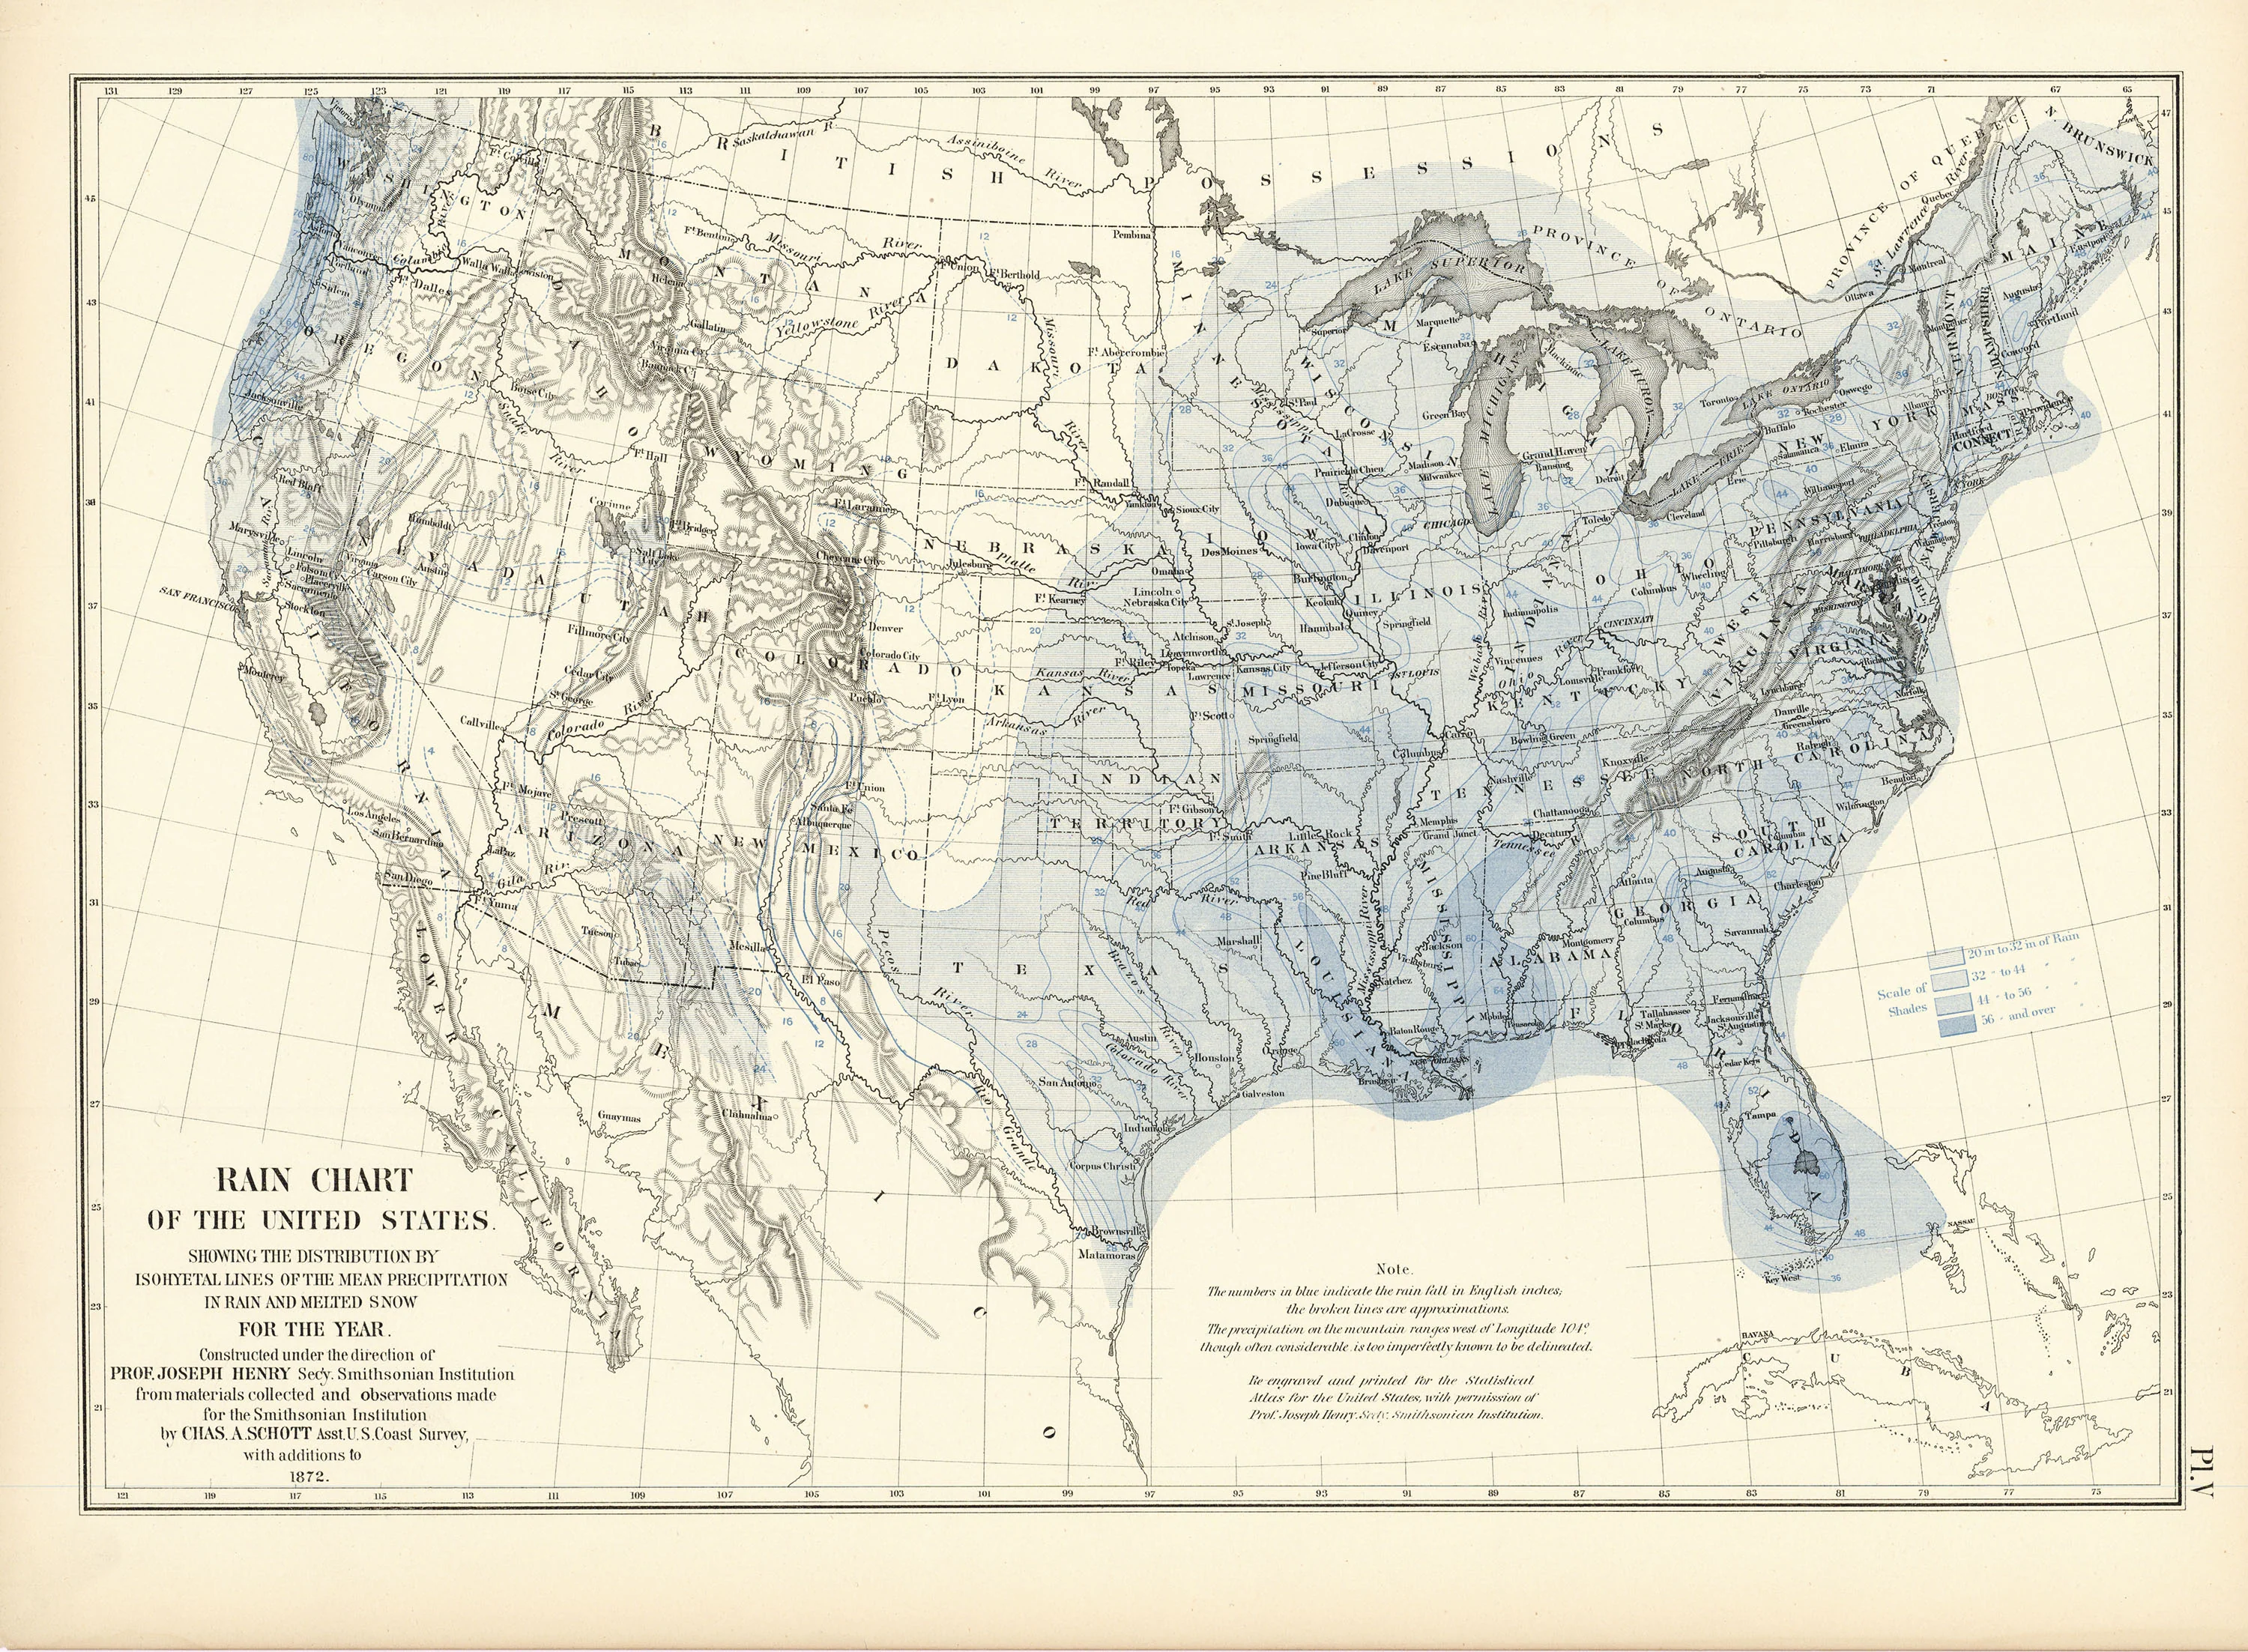
Rain Chart of the United States: Walker 1874
- Title: Frequency of Storm Centres
- Author: Francis A. Walker
- Date: 1874
- Medium: Chromolithograph
- Condition: Very Good Plus - age toning, minor paper loss in margins
- Inches: 21 3/4 x 15 7/8 [Paper]
- Centimeters: 55.25 x 40.32 [Paper]
- Product ID: 316071
Rain Chart of the United States. Showing the Distribution by Isohyetal Lines of the Mean Precipitation in Rain and Melted Snow for the Year. Constructed under the direction of Prof. Joseph Henry Sec'y. Smithsonian Institution from materials collected and observations made for the Smithsonian Institution by Chas. A. Schott Asst. U.S. Coast Survey, with additions to 1872.
Map showing the average yearly precipitation within the United States, chromolithographed by Julius Bien. Bien (1826-1909) was born in Naumburg, Germany to a Jewish family. Best known for his scientific maps of the United States, Bien gained a reputation as a master lithographer and the foremost American scientific cartographer of his day. Coming of age as a young German in the mid-1840s, Bien studied art at both the Kunsthochschule Kassel as well as the Städel Institute in Frankfurt until the Revolutions of 1848 disrupted his burgeoning career. As liberal uprisings spread across Europe, Bien fought for causes such as German unity, freedom of the press, and freedom of assembly, as did many others of Jewish descent. After this revolutionary wave failed to take hold, Bien and other liberals went into exile; he fled to New York in 1849, where he established a small lithographic business and soon made a name for himself as a printer of exceptional skill.
- Title: Frequency of Storm Centres
- Author: Francis A. Walker
- Date: 1874
- Medium: Chromolithograph
- Condition: Very Good Plus - age toning, minor paper loss in margins
- Inches: 21 3/4 x 15 7/8 [Paper]
- Centimeters: 55.25 x 40.32 [Paper]
- Product ID: 316071
Rain Chart of the United States. Showing the Distribution by Isohyetal Lines of the Mean Precipitation in Rain and Melted Snow for the Year. Constructed under the direction of Prof. Joseph Henry Sec'y. Smithsonian Institution from materials collected and observations made for the Smithsonian Institution by Chas. A. Schott Asst. U.S. Coast Survey, with additions to 1872.
Map showing the average yearly precipitation within the United States, chromolithographed by Julius Bien. Bien (1826-1909) was born in Naumburg, Germany to a Jewish family. Best known for his scientific maps of the United States, Bien gained a reputation as a master lithographer and the foremost American scientific cartographer of his day. Coming of age as a young German in the mid-1840s, Bien studied art at both the Kunsthochschule Kassel as well as the Städel Institute in Frankfurt until the Revolutions of 1848 disrupted his burgeoning career. As liberal uprisings spread across Europe, Bien fought for causes such as German unity, freedom of the press, and freedom of assembly, as did many others of Jewish descent. After this revolutionary wave failed to take hold, Bien and other liberals went into exile; he fled to New York in 1849, where he established a small lithographic business and soon made a name for himself as a printer of exceptional skill.
Original: $125.00
-65%$125.00
$43.75Description
- Title: Frequency of Storm Centres
- Author: Francis A. Walker
- Date: 1874
- Medium: Chromolithograph
- Condition: Very Good Plus - age toning, minor paper loss in margins
- Inches: 21 3/4 x 15 7/8 [Paper]
- Centimeters: 55.25 x 40.32 [Paper]
- Product ID: 316071
Rain Chart of the United States. Showing the Distribution by Isohyetal Lines of the Mean Precipitation in Rain and Melted Snow for the Year. Constructed under the direction of Prof. Joseph Henry Sec'y. Smithsonian Institution from materials collected and observations made for the Smithsonian Institution by Chas. A. Schott Asst. U.S. Coast Survey, with additions to 1872.
Map showing the average yearly precipitation within the United States, chromolithographed by Julius Bien. Bien (1826-1909) was born in Naumburg, Germany to a Jewish family. Best known for his scientific maps of the United States, Bien gained a reputation as a master lithographer and the foremost American scientific cartographer of his day. Coming of age as a young German in the mid-1840s, Bien studied art at both the Kunsthochschule Kassel as well as the Städel Institute in Frankfurt until the Revolutions of 1848 disrupted his burgeoning career. As liberal uprisings spread across Europe, Bien fought for causes such as German unity, freedom of the press, and freedom of assembly, as did many others of Jewish descent. After this revolutionary wave failed to take hold, Bien and other liberals went into exile; he fled to New York in 1849, where he established a small lithographic business and soon made a name for himself as a printer of exceptional skill.